Visualising a Skip List
If the skip list is compiled with INCLUDE_METHODS_THAT_USE_STREAMS defined both the HeadNode and Node gain the methods dotFile and dotFileFinalise.
These can be used to write out the current state of the skip list to sdtout in DOT (GraphViz) format. These can be converted to SVG or PNG using dot.
Multiple snapshots of the same skiplist can be taken and plotted in the same graph. Each snapshot is denoted by a number.
| Function | Description |
|---|---|
dotFile() |
Arguments are: an output stream. |
dotFileFinalise() |
Arguments are: an output stream. |
Simple Example in C++
This takes a single snapshot of the skip list. Create a skip list and insert 5 values into it.
Then call dotFile() to write out the state of the skip list stdout and dotFinalise() to complete the graph.
#include "SkipList.h"

void doc_insert_simple() {
    OrderedStructs::SkipList::HeadNode<int> sl;

    sl.insert(42);
    sl.insert(84);
    sl.insert(21);
    sl.insert(100);
    sl.insert(12);

    sl.dotFile(std::cout);
    sl.dotFileFinalise(std::cout);
}
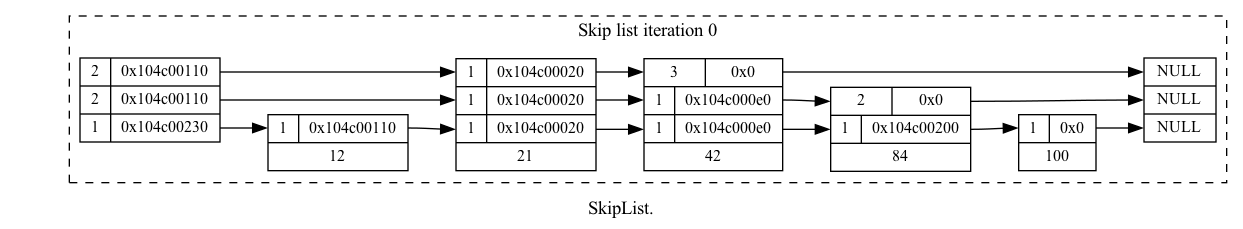
Saving stdout to a text file, say doc_simple.dot then running this on the command line:
dot -odoc_simple.png -Tpng doc_simple.dot
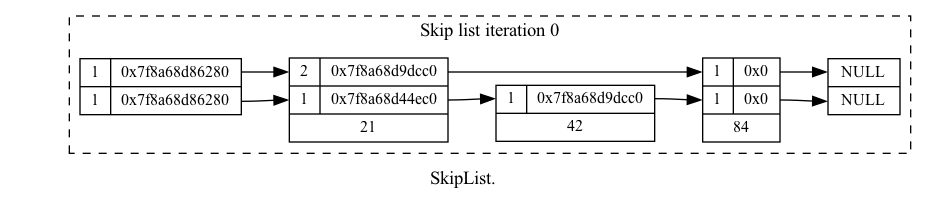
Will produce something like this SVG diagram:
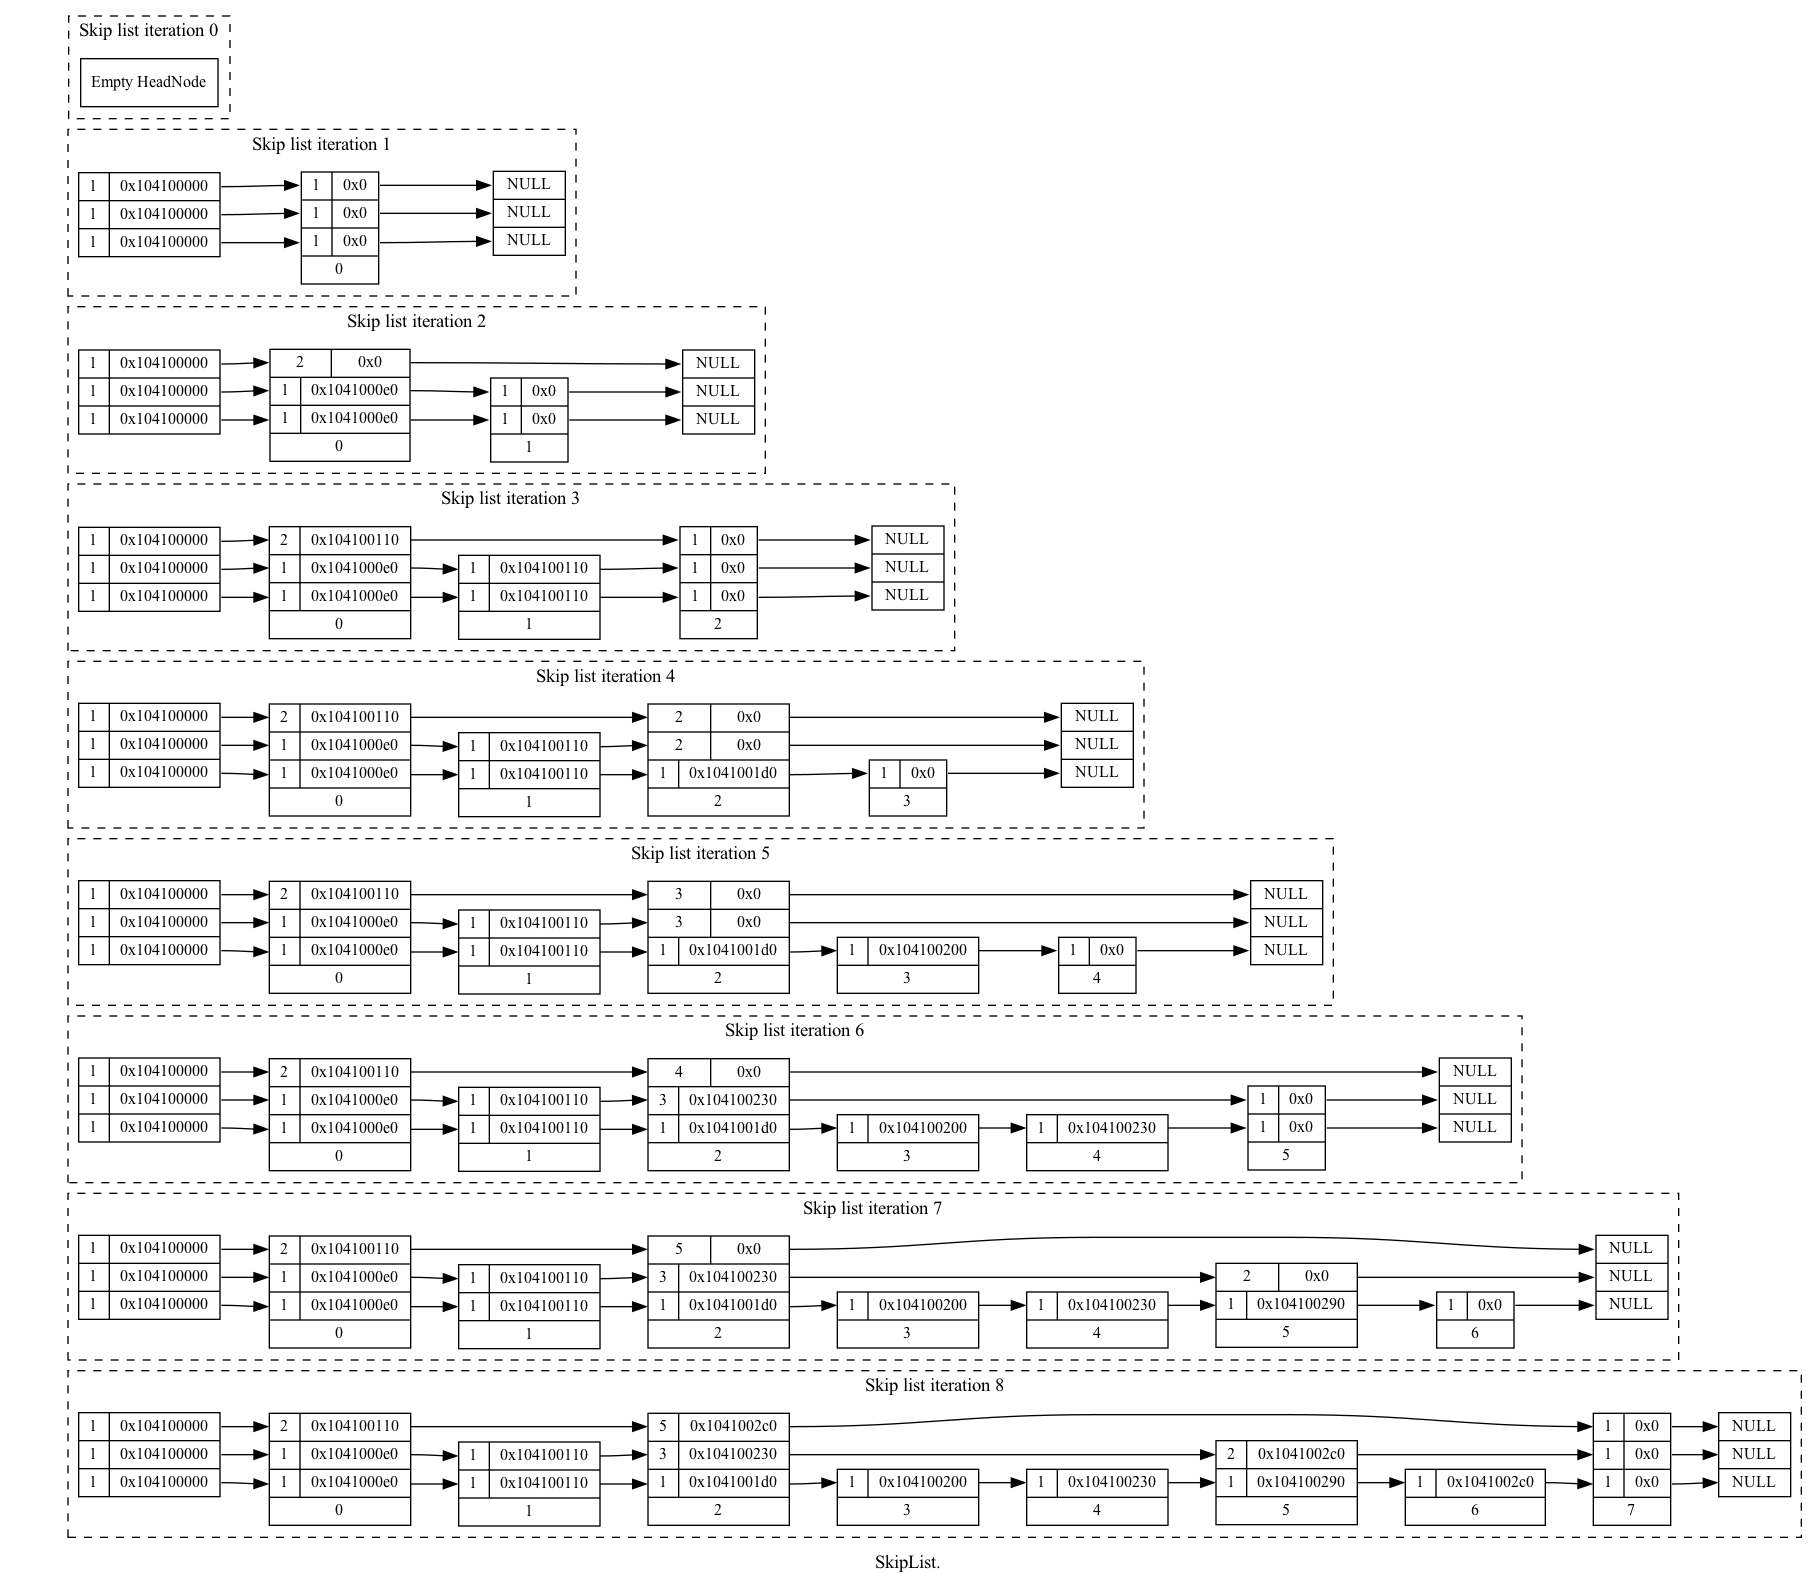
Inserting the Values 0 to 7
Multiple snapshots can also be created showing how the skiplist grows and shrinks. This diagram was created with the following C++ code:
#include "SkipList.h"

void doc_insert() {
    OrderedStructs::SkipList::HeadNode<int> sl;

    // Write out the empty head node
    sl.dotFile(std::cout);
    // Now insert a value and add the current representation to the DOT file
    for (int i = 0; i < 8; ++i) {
        sl.insert(i);
        sl.dotFile(std::cout);
    }
    // Finalise the dot file with the number of snapshots, this updates internal references
    sl.dotFileFinalise(std::cout);
}
Saving this output to a text file, say doc_insert.dot then running this on the command line:
dot -odoc_insert.png -Tpng doc_insert.dot
Will produce this [doc_insert.png]:
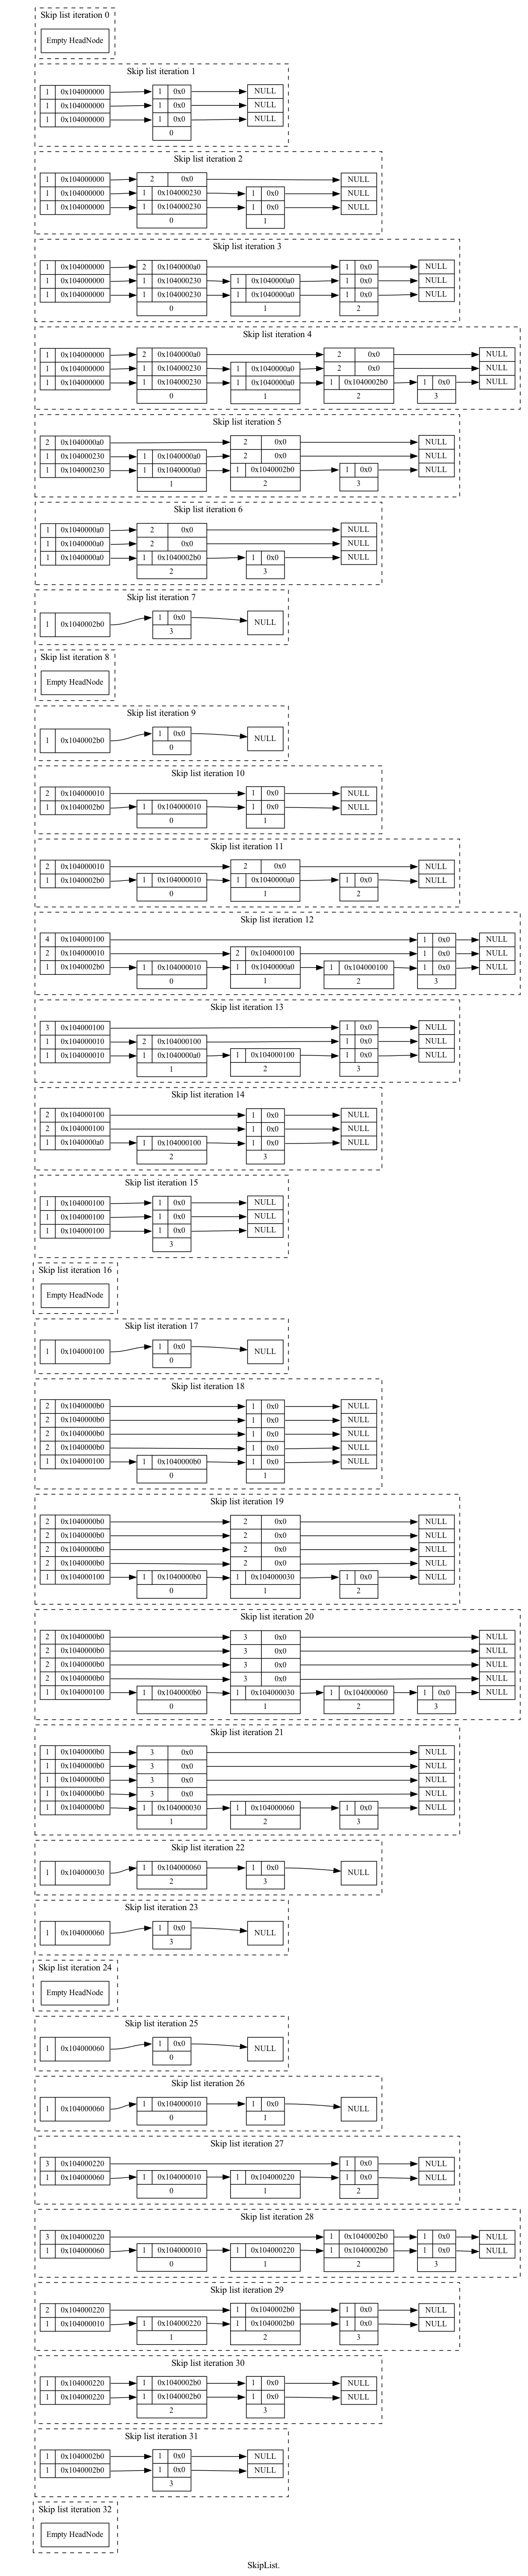
Inserting the Values 0 to 3 and Removing them Multiple Times
This visualisation is produced by this code:
#include "SkipList.h"

void doc_insert_remove_repeat() {
    int NUM = 4;
    int REPEAT_COUNT = 4;

    OrderedStructs::SkipList::HeadNode<int> sl;

    sl.dotFile(std::cout);
    for (int c = 0; c < REPEAT_COUNT; ++c) {
        for (int i = 0; i < NUM; ++i) {
            sl.insert(i);
            sl.dotFile(std::cout);
        }
        for (int i = 0; i < NUM; ++i) {
            sl.remove(i);
            sl.dotFile(std::cout);
        }
    }
    sl.dotFileFinalise(std::cout);
}
Produces this image, note how the shape of the skip list nodes changes with repeated inserts.
Simple Example in Python
The Python interface is via a single function .dot_file() that returns a bytes object that is suitable for saving as a .dot file.
import cSkipList

sl = cSkipList.PySkipList(float)

sl.insert(42.0)
sl.insert(21.0)
sl.insert(84.0)

dot_bytes = sl.dot_file()

with open('doc_simple_py.dot', 'w') as dot_file:
    dot_file.write(dot_bytes.decode('ascii'))
doc_simple_py.dot will look something like:
digraph SkipList {
label = "SkipList."
graph [rankdir = "LR"];
node [fontsize = "12" shape = "ellipse"];
edge [];

subgraph cluster0 {
style=dashed
label="Skip list iteration 0"

"HeadNode0" [
label = "{ 1 | <f2> 0x7f8a68d86280} | { 1 | <f1> 0x7f8a68d86280}"
shape = "record"
];
"HeadNode0":f1 -> "node00x7f8a68d86280":w1 [];
"HeadNode0":f2 -> "node00x7f8a68d86280":w2 [];

"node00x7f8a68d86280" [
label = " { <w2> 2 | <f2> 0x7f8a68d9dcc0 } | { <w1> 1 | <f1> 0x7f8a68d44ec0 } | <f0> 21"
shape = "record"
];
"node00x7f8a68d86280":f1 -> "node00x7f8a68d44ec0":w1 [];
"node00x7f8a68d86280":f2 -> "node00x7f8a68d9dcc0":w2 [];
"node00x7f8a68d44ec0" [
label = " { <w1> 1 | <f1> 0x7f8a68d9dcc0 } | <f0> 42"
shape = "record"
];
"node00x7f8a68d44ec0":f1 -> "node00x7f8a68d9dcc0":w1 [];
"node00x7f8a68d9dcc0" [
label = " { <w2> 1 | <f2> 0x0 } | { <w1> 1 | <f1> 0x0 } | <f0> 84"
shape = "record"
];
"node00x7f8a68d9dcc0":f1 -> "node00x0":w1 [];
"node00x7f8a68d9dcc0":f2 -> "node00x0":w2 [];

"node00x0" [label = "<w2> NULL | <w1> NULL" shape = "record"];
}

node0 [shape=record, label = "<f0> | ", style=invis, width=0.01];
node0:f0 -> HeadNode0 [style=invis];
}
Running:
dot -odoc_simple_py.png -Tpng doc_simple_py.dot
Will produce something like this: